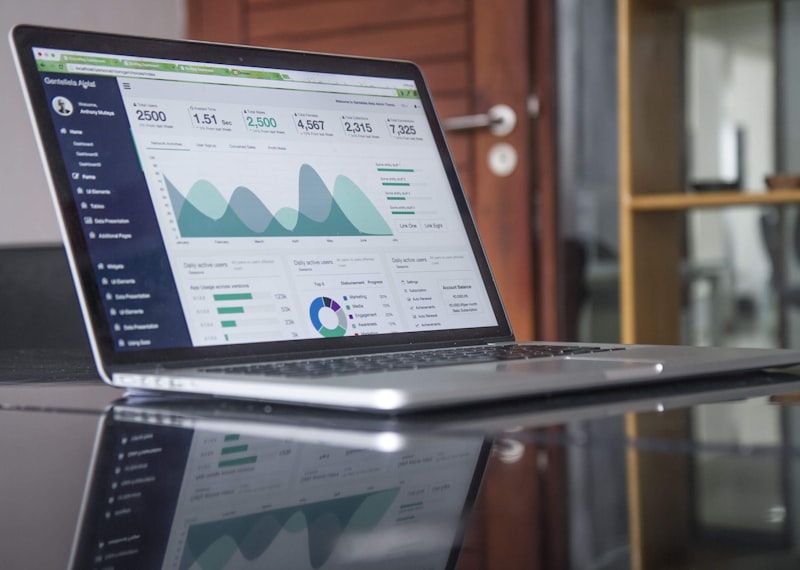


Signal hierarchy first
Learn ranking rules that keep primary KPIs legible even when product asks for “just one more chart.”
Sensortrailbase
Turn scattered app signals into dashboards people actually trust.
We coach product designers and analysts through Analytics Dashboard Design for Apps — hierarchy, motion, and measurement language that stays readable under pressure.
 Live KPI map
Bangkok studio
Live KPI map
Bangkok studio
Voices from recent cohorts
After the “Density without noise” module in Signal to Screen, our retention board finally stopped looking like a Christmas tree. I still want more mobile critique sessions, but the desktop patterns stuck.
Sensortrailbase pushed our squad to name every widget by the decision it supports. The Lattice Craft office hours caught three vanity metrics we had been defending for months.
Programs
Each track blends critique, pattern libraries, and instrumentation literacy so your Analytics Dashboard Design for Apps work holds up in sprint reviews.
Why teams book us
Learn ranking rules that keep primary KPIs legible even when product asks for “just one more chart.”
Practice filters, empty states, and hover reveals that explain change without drowning the page.
Live sessions from Bangkok with bilingual facilitation habits that respect regional product tempos.
Start with Dashboard Craft notes or talk to us about a private cohort for your product org.